NHS South East London (NHS SEL) has used innovative spatial analysis to identify the best sites for its first two women’s and girls’ health hubs. Designed to improve access to services and reduce inequalities in women’s and girls’ health, the hubs are now offering a core range of services to deliver integrated care at neighbourhood level, including menopause, contraception and period or menstrual problems like heavy or irregular bleeding. The new facilities also meet the requirement to re-use existing buildings within the estate.
The NHS SEL Analytics team wanted to use geospatial analysis to help solve real-world issues and this was a perfect use case. Examining service usage and demographic data across NHS SEL’s six boroughs at the most granular level, resulted in precise locations in Lambeth and Greenwich being revealed as the most beneficial to patients in terms of need and proximity, thus helping to improve health outcomes.
Traditionally, data was mostly presented using charts and tables, aggregated by borough. However, primary and secondary care activity is available at a more granular level, by Lower Layer Super Output Areas (LSOAs) based on a person’s residence. LSOA refers to a geographic area that usually contains a population of around 1,000 to 3,000 people, the most granular residential information NHS South East London receive on their population. This project aimed to determine what the best location would be for new women’s health hubs in Southeast London. To identify the best possible location, NHS SEL took a new approach using Esri’s geospatial mapping technology to identify trends and service demand by location at LSOA level, allowing the team to visualise if and where hotspots of activity occur. In addition to looking at service demand, the Geographic Information System (GIS) software helped them to understand which sites were most accessible via public transportation.
Lambeth’s hub currently operates as a virtual triage model, with plans to transition to an in-person hub based within an existing GP practice. The new Greenwich site is located within an existing community health centre alongside sexual, reproductive and contraception health services. Centrally located in the borough, it has easy access to transport links and serves an area of high deprivation, aiming to reduce health inequalities.
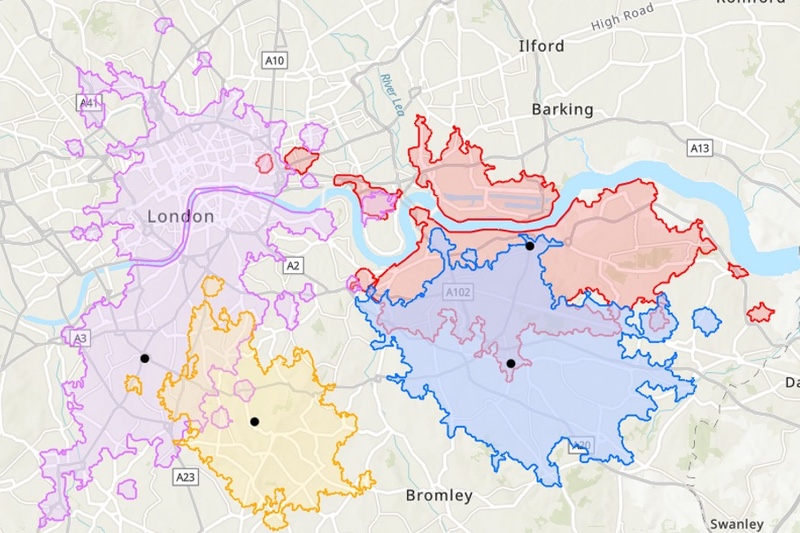
Journey time analysis was considered to identify which sites were the most accessible
The spatial analysis examined existing service usage in primary and secondary care for long-acting reversible contraceptives, heavy menstrual bleeding and menopause treatments over time. This was aggregated by LSOA to identify the areas of patient residence for those who have the most appointments and attendances for the above health needs. It was important to identify which potential hub sites were situated close to patients needing the most care.
Alongside the challenges that accompany learning to use a new software, there were considerations around how to use rich sources of data, that span multiple healthcare settings and are linked by a common pseudonymised NHS number. Initially, the team planned to map the data at a patient level to assess the service usage of residents from a particular area and how it differed based on demographic factors such as ethnicity, deprivation and age.
The data was sourced from both


