The nurses’ station alarm sounds again. Then again. Then again.
By the end of the shift, staff have responded to twenty alarms. Most are false.
Eventually something changes.
Not consciously. Not deliberately.
But gradually the brain adapts.
The alarm becomes background noise. Urgency fades. And when a real event happens, people stop reacting with the same intensity, the response may be slower than it should be.
If this feels familiar, your ward may have excess alarms.
This is alarm fatigue. It creates a dangerous level of desensitisation in environments where seconds matter.
So here is the question that matters:
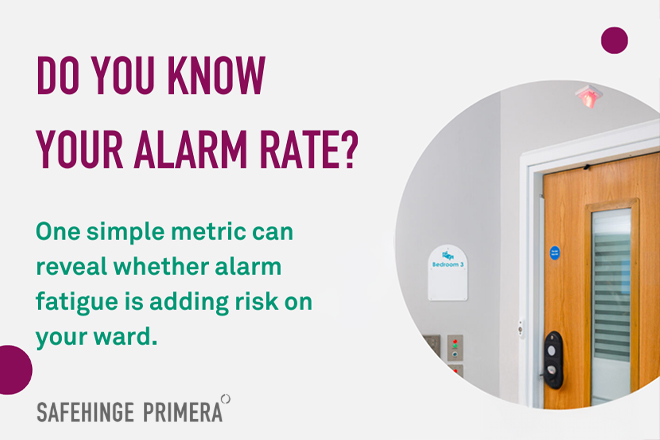
Do you know your alarm rates?
The metric that reveals the problem
Across mental health wards, alarm systems are often evaluated informally.
Teams might say things like:
“We get quite a few alarms.”
“It seems busy lately.”
“That door causes a lot of alerts.”
The problem is that these observations are difficult to compare between wards, buildings, and systems. Without a measurable benchmark, it is almost impossible to know whether a system is working well or overwhelming staff.
Through working closely with trusts and their clinical and estates teams, we have developed a simple metric for tracking the number of alarms, allowing us to reduce the threat of alarm fatigue.
Alarms per door per month.
This metric does four important things:
- Creates a consistent benchmark across wards.
- Allows fair comparison between different systems.
- Identifies problem doors early.
- Establishes a baseline for monitoring alarm performance improvements.
Once you track alarm frequency per door, patterns become clear very quickly.
The benchmark scale: what good looks like
For a typical 23 bedroom mental health ward with ligature alarms on each door, alarm data tends to fall into four clear categories.
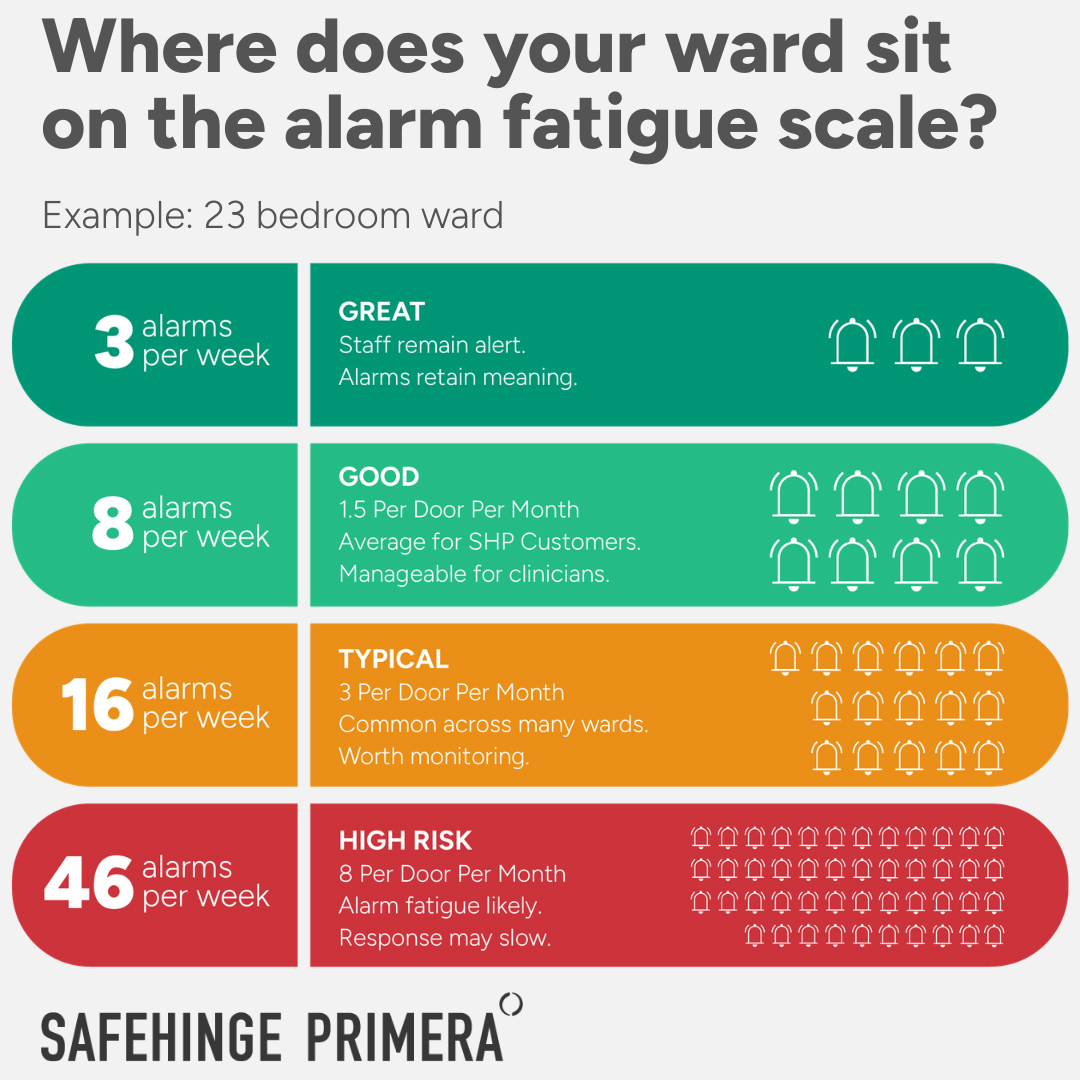
Great
0.5 alarms per door per month.
Feels like one alarm every two or three days across the ward.
This level has been achieved in multiple Trusts through careful calibration and ongoing monitoring. Staff remain alert and confident that when an alarm activates, it is likely to require immediate attention.
Good
1.5 alarms per door per month.
Feels like roughly one alarm per day across the ward.
This is close to the current cross-site average observed in many Safehinge Primera installations. At this level staff typically remain responsive and the system remains manageable during busy shifts.
Typical
3 alarms per door per month.
Feels like around two alarms per day somewhere on the ward.
Many systems operate at this level. Staff can usually manage the volume, but the repeated interruptions gradually begin to strain attention and increase the risk of alarm fatigue over time.
High risk
8+ alarms per door per month.
Feels like an alarm somewhere on the ward every few hours.
At this level alarms become constant background noise. Staff are highly likely to experience alarm fatigue, increasing the risk that a genuine ligature event receives a slower response.
A hidden warning sign: instant alarm resets
There is another signal hidden inside alarm data.
Instant resets.
When reviewing alarm dashboards with clinicians, we sometimes see alarms that are triggered and cleared within a second or two.
In most clinical scenarios this should rarely happen.
Staff still need time to reach the panel or mobile device before resetting an alarm.
When alarms appear to be reset instantly, it may indicate something else is happening.
For example:
- Alarm acknowledgement processes are being bypassed.
- Alarm workflows are being ignored.
- Staff have become so accustomed to alerts that they clear them reflexively.
- Alarm frequency has already created fatigue.
In short, the system may be generating too much noise for meaningful clinical response.
This is not a theoretical concern. It is behaviour we have observed in real alarm data across multiple wards.
Alarm fatigue is a recognised clinical and patient safety risk
Alarm fatigue is not just an operational inconvenience. It is a recognised patient safety risk across healthcare systems.
When alarms trigger too frequently:
- Response to genuine ligature attempts can slow.
- Cognitive load increases during already demanding shifts.
- Staff frustration and burnout rise.
- Trust in the alarm system erodes.
Research published in BMJ Open Quality identifies alarm fatigue as a major safety challenge that contributes to staff burnout and reduces the effectiveness of monitoring systems.
Patient safety research has also highlighted the issue in mental health wards, where excessive alerts can create distraction rather than meaningful warnings.
In simple terms:
When everything alarms, nothing feels urgent.
Alarm fatigue is not inevitable
High alarm rates are not an unavoidable feature of ligature detection systems.
In many cases, the alarm system itself is not the problem. The issue lies in how it is calibrated, monitored, and maintained over time.
Common causes of excessive alarms include:
- Detection thresholds set too sensitively.
- Poor calibration during installation.
- Lack of ongoing performance monitoring.
- No structured review once the system is live.
Without monitoring, a single poorly calibrated door can generate dozens of unnecessary alarms every month.
The extra risk layer
Alarm frequency also reveals something else.
It adds another layer of clinical risk visibility.
Across monitored installations, alarm rates typically fall into three practical categories.
Alarm rate per door — Risk interpretation
0.5 per month — Great
1.5 per month — Good
3 per month — Typical
8+ per month — High risk
This simple scale allows estates teams and safety leaders to immediately understand whether their system is operating within a safe range.
The solution: proactive monitoring
Reducing alarm fatigue requires a simple shift in approach.
Instead of reacting to complaints, leading Trusts now work with providers to monitor alarm performance proactively.
This usually includes two elements.
Performance monitoring
- Monthly tracking of alarms per door.
- Identification of outlier doors generating excessive alerts.
- Early intervention before staff frustration builds.
Collaborative quality improvement
- Staff training on system behaviour.
- On-site calibration and technical review.
- Continuous feedback between clinical teams and engineers.
This has been evidenced with results from joint Q1 initiatives, working alongside trusts such as Mersey Care NHS Foundation Trust which saw a 99% decrease in alarm rates. This was done through proactive monitoring, followed by working collaboratively with clinical and estates teams to refine operating procedures and best practice.
Using these learnings we have been able to engage with other trusts in order to reduce their alarm rates. These are already showing promising results such as with Avon and Wiltshire Mental Health Partnership Trust as well providing further learnings which are used to understand how to get the most from full door ligature alarms.
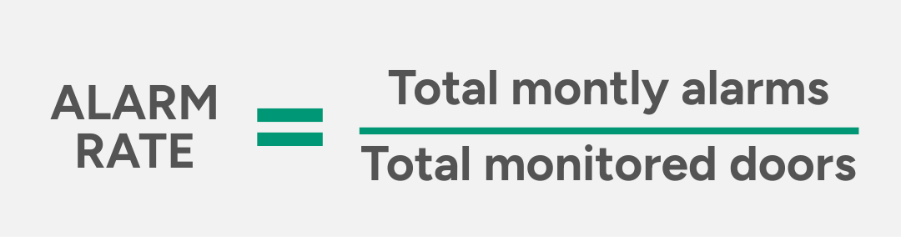
How to calculate your alarm rate
Most wards already have the data needed.
Step 1: Gather your numbers.
You need two figures:
- Total number of alarm activations in one month.
- Total number of monitored bedroom doors.
Use a full calendar month for accuracy.
Step 2: Apply the formula.
Alarm rate per door per month.
Example calculations
High risk scenario
Total alarms: 184
Doors: 23
184 ÷ 23 = 8 alarms per door per month
This level will almost certainly lead to alarm fatigue.
Typical scenario
Total alarms: 46
Doors: 23
46 ÷ 23 = 2 alarms per door per month
Common across many wards.
Worth monitoring to ensure alarms do not begin to increase over time.
What good looks like
Total alarms: 32
Doors: 23
32 ÷ 23 = 1.4 alarms per door per month
Effective and maintainable with good practice.
What great looks like
Total alarms: 12
Doors: 23
12 ÷ 23 = 0.5 alarms per door per month
Staff remain alert and alarms retain their meaning.
Keep it calm and clinical
Alarm systems should support calm, confident clinical response.
Not constant background noise.
So it is worth asking just one simple question:
Do you know your alarm rate per door per month?
If you are unsure, we are happy to help.
We can benchmark your data confidentially against what good looks like across multiple Trusts.
No obligation. Just clarity.


